As a scientist, your ability to tell a story is as important to your career as knowing how to design experiments. Of all the skills needed to successfully move from academia to industry, good storytelling may be the one that takes the most effort. If good science is the process of obtaining meaningful data, good science communication is using that data to tell a story. This story may be as simple as one chart that clearly shows a cause and effect relationship, or as complex as a scientific journal publication.
If you put in the years to get a doctorate degree, likely you won’t be satisfied simply carrying out experiments and generating data; you will want to be the one designing experiments, deciding which data to get, and interpreting what it means. But often, scientists in industry can become frustrated when the important decisions are made by business people. The one who gathers the data, no matter how talented, is “just a scientist.” One way to move beyond the role of “data gatherer” is to master the narrative research story. A simple reason is clarity: if the decision-makers can’t understand your data, they will appoint someone to explain it. In industry, this is known as a boss. There is a broader reason for a scientist to be a good storyteller, and that is to be the safekeeper of good data.
As scientists, the need for good communication is simple: data does not explain itself. But there is another challenge: Assume you’ve distilled lots of data into a clear and lucid report and have found someone who actually reads it. Once it is read, will the message survive in the reader’s memory long enough to make it to the next meeting? One reason stories are so powerful is they are easily remembered and shared. Because all business is based on people, stories are a type of currency. Good storytelling enables your scientific thinking to reach people beyond your lab, where it can do the most good.
Stories are the lifeblood of business, and this is especially true for startups. If you spend some time in Silicon Valley, you might think that every tech company was started in a garage by college dropouts. The origin stories of Facebook, Apple, Google, and many others are modern mythology. Like all good mythology, the strength of these stories is in engaging the imagination, not historical accuracy.
Data-based stories, on the other hand, can suffer from the rigidity of facts. What is the core technology? How does it work? What are the risks and benefits, and how do they compare to the competition? These stories must come from technical experts. The only problem is, scientists & engineers rarely present stories – they present collections of facts. The emphasis is on accuracy, not narrative – and all the facts in the world cannot make them as compelling as a good elevator pitch. The solution is not to bend, ignore, or minimize facts – it is to make the facts into a narrative. Scientists who want decisions to be based on data must learn to be good storytellers.
Fortunately for scientists, there are many resources to help tell stories with data. True masters of the art are people like Edward Tufte and Jean-Luc Doumont (see references below). They have made it their job to teach scientists to present data with pictures and clear analytical thinking. There is a growing body of work on the subject as people see the value in science communication as a career skill. But reading and studying is just the beginning – telling stories with data takes real work, revision, and practice.
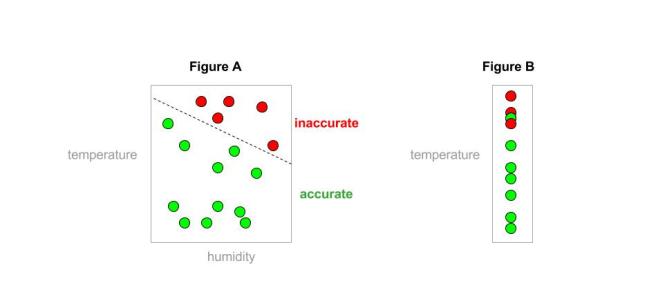
Here’s an example of storytelling gone wrong, with data fictionalized for anonymity: I worked with a coworker after many unsuccessful attempts to explain the limitations of a technology to our managers. We plotted all the accuracy data of our device in one two-dimensional graph, with correct results in green and incorrect results in red (Figure A). It clearly showed (to us) that our accuracy broke down in conditions that our customer cared about (high temperature). In our minds, this was a rock-solid argument that the project could not move forward without basic research into the cause of the failure. The management loved the graph, and delivered it to investors with the following message: We are on the right track, and a little more time is all it will take to push into the “red zone.” No research required. In retrospect, I could have used a much simpler graph (Figure B), that more naturally leads to the following question: Why does the device fail at high temperatures? Because that question was never asked, the true message of the data was lost.
Clear science communication can have a huge impact in the quality of your work, and it will be recognized by your scientific colleagues. But to really help in your non-academic career, you need to be a good storyteller to nonscientists. This is a question of language and style, as much as data. Listen to master storytellers – podcasts like Startup, Planet Money, Signal, Science vs.; they have learned to take complex subjects and turn them into a meaningful story anyone can relate to. More importantly, they do not sacrifice accuracy for simplicity. When it comes to communicating your work, never be satisfied with saying, “they just don’t get it.” Your data tells a story, and it’s up to you to find it. If you don’t tell the story of your data, someone else will do it for you.
Resources:
Edward R. Tufte, Visual Explanations http://www.edwardtufte.com/tufte/books_visex
An examination not only of visual data presentation, but the analytical thinking that it requires. Ask me about how I got it for free at a garage sale – true story.
Jean-Luc Doumont, Trees, Maps, and Theorems http://www.treesmapsandtheorems.com/
Simply beautiful – a guide to organizing and communicating data in the clearest and most meaningful way. Just bought my 2nd copy. One for work, one for home.
Planet Money Podcast – if you ever think what you’re doing is too complicated to explain to “normal people” this is how it’s done.
Science vs. Podcast – This show from Australian Broadcasting Corporation breaks down the scientific research on topics from happiness to the paleo diet – geared to general audiences.
Signal Podcast – Created by two biotech journalists, this show weaves great stories out of the science and business of the pharmaceutical and biotech industries.
Startup Podcast – Not only great storytelling, but also gives a lot of insight into the human factors that affect the rise and fall of startup companies.
This American Life, on the corporate creation myth (2014)

I am in a similar role, and I completely agree that only being able to communicate science to your peers is not enough to be successful, especially not in a business environment. It takes patience and care to tell the story in way that non-experts will a) understand and b) remember, and it’s not a skill that is emphasized in graduate training.
My advice to young scientists: start taking the opportunity to try and explain your research to non-experts. You can start with your family. Expect to be frustrated, it’s not easy. But distilling it down to the really important pieces can give you a fresh perspective on your own work, and explaining complexity in a way that’s simple will be vital to your success as a scientist, whether you’ll be writing grants or advising a non-scientist boss.
I also recommend the book Marketing for Scientists, which provides an interesting perspective from a physicist who has also made a career writing and selling songs in Nashville.
LikeLiked by 1 person
Great advice – thanks Phil!
LikeLike